跳转到主内容

Cassand拉 数据库的StorageGRID高CPU利用率会导致S3客户端延迟增加

Views:
1
Visibility:
Public
Votes:
0
Category:
storagegrid<a>2009523687</a>
Specialty:
sgrid
Last Updated:

适用场景

  • NetApp 存储网格
  • 软件版本11.6及更高版本

问题描述

  1. 下面显示的所有指标均可在StorageGRID网格管理器 中的“支持 ”> “指标”下找到
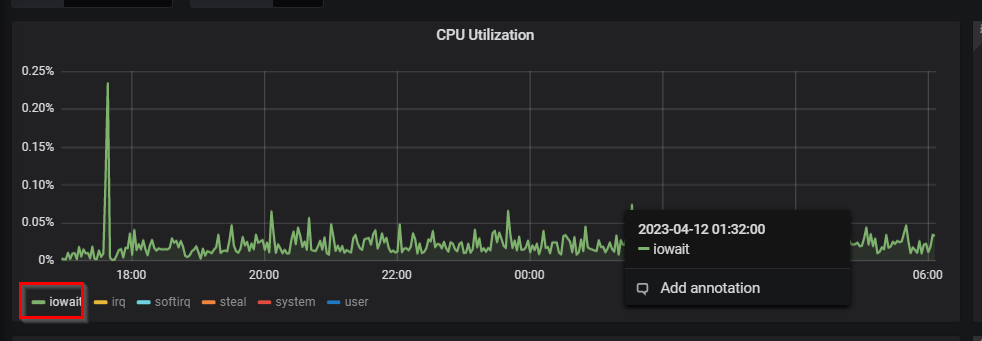
  2. 存储节点显示的Cassand拉CPU利用率超过85%、 而I/O 等待时间极短。可在 Node (Internal Use) Grafana信息板下找到此信息。
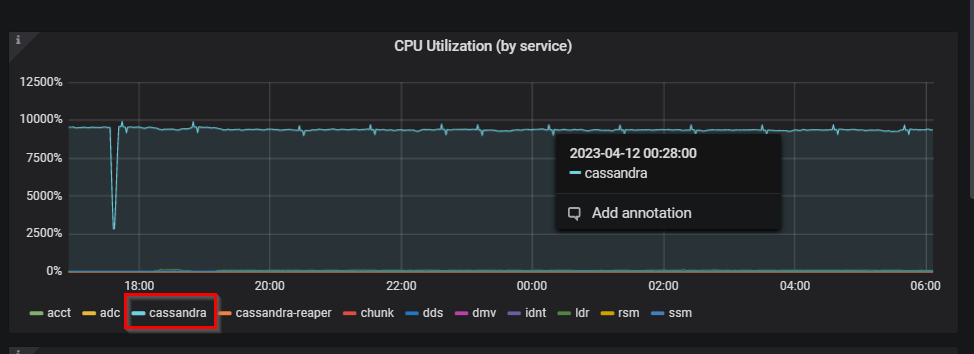
大量Cassanda任务待定任务队列太大KB CPU利用率(按服务).png

大量Cassand拉 任务待定任务队列太大KB CPU Utilization.png

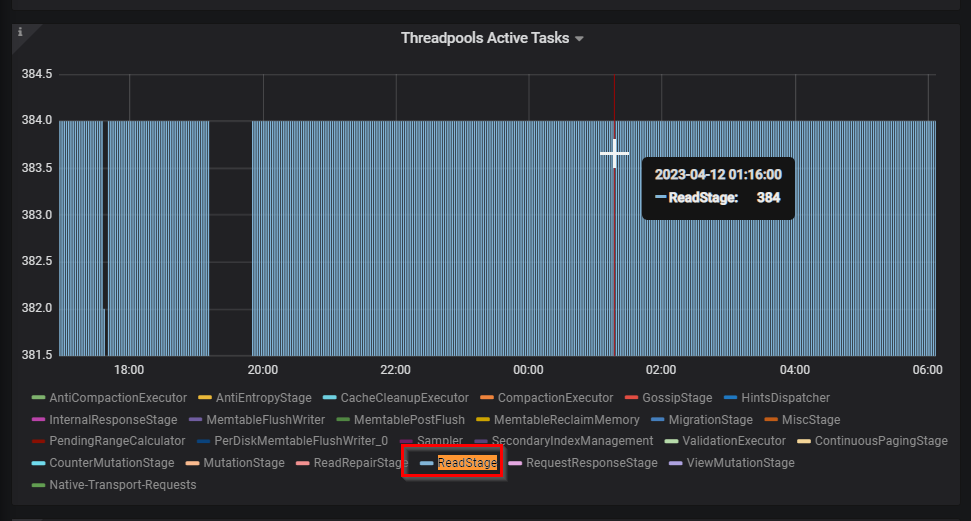
  1. Cassand拉ReadStage始终处于其最大级别。可 在 CassandraNode OverviewGrafana信息板下找到此信息。
大量Cassand拉 任务待定任务队列太大KB线程池活动Tasks.png
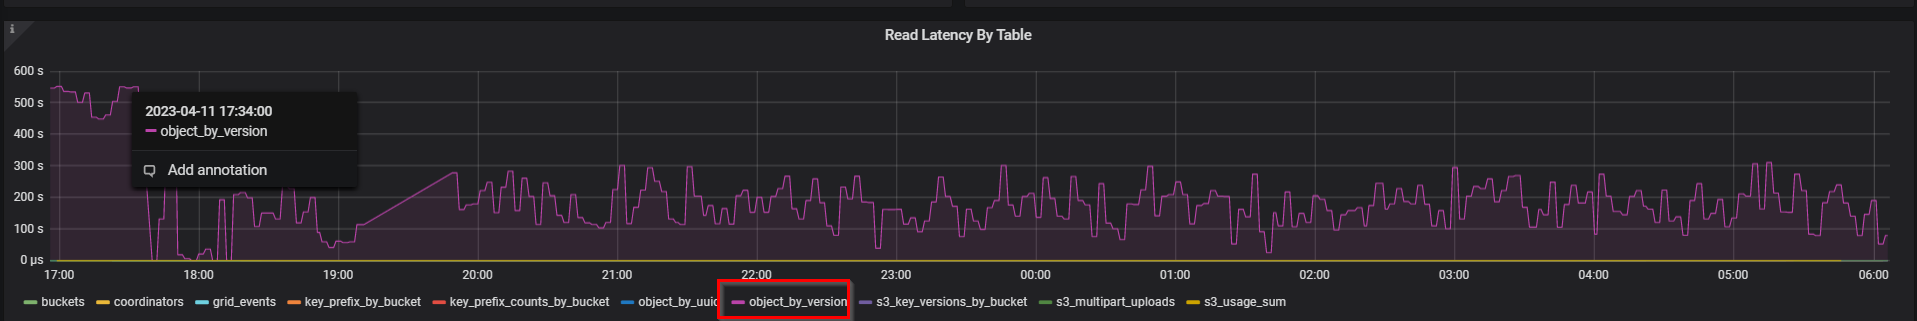
  1. 一个Cassanda表显示数百秒内的极高延迟。可在 CassandraNode Overview Grafana信息板下找到此信息。
    1. 以下示例显示了具有如此高延迟的object_by_version。请注意 、它可以是任何表。

大量Cassand拉 任务待定任务队列太大KB读取延迟、作者为Table.png

  1. 在节点的Cassand拉 目录中、以下命令将返回100个以上的条目。请考虑检查轮换日志文件(即 jstack.log.1)。 

# cd /var/local/log/cassandra/jstack/
# grep -c Murmur3 jstack.log
8393

Sign in to view the entire content of this KB article.

New to NetApp?

Learn more about our award-winning Support

NetApp provides no representations or warranties regarding the accuracy or reliability or serviceability of any information or recommendations provided in this publication or with respect to any results that may be obtained by the use of the information or observance of any recommendations provided herein. The information in this document is distributed AS IS and the use of this information or the implementation of any recommendations or techniques herein is a customer's responsibility and depends on the customer's ability to evaluate and integrate them into the customer's operational environment. This document and the information contained herein may be used solely in connection with the NetApp products discussed in this document.